
Trading Education Hub
Footprint, orderflow, L2, and market basics — curated for serious growth.
Footprint & Orderflow
Introduction
Footprint and orderflow analysis reveal what's happening inside each candle, showing you exactly who is in control—buyers or sellers. This method lets traders read the market from the inside out by examining volume, delta, and buying/selling pressure at each price level.
Core Breakdown
Footprint Charts
A footprint chart displays:
- -Volume traded at each price level
- -Aggressive buyers (market buys)
- -Aggressive sellers (market sells)
- -Imbalances and absorption zones
This helps you identify where institutions are active.
Orderflow Dynamics
Orderflow expands on footprints by analyzing:
- -Delta (net buy volume - sell volume)
- -Stacked imbalances (indicating directional pressure)
- -Absorption (large passive orders stopping price)
- -Initiative vs. Responsive activity
You're essentially tracking the intention and strength behind each price move.
What to Look For
Volume Clusters (High-Volume Nodes)
Areas where lots of trades occur often become future support/resistance.
Strong Delta Shifts
Sudden surges in buying or selling delta often indicate the start of a move.
Stacked Imbalances
Three or more imbalances in one direction often show institutional aggression.
Absorption Levels
Price struggles to break a level despite heavy orders = likely reversal.
Visual Diagram - Footprint Examples
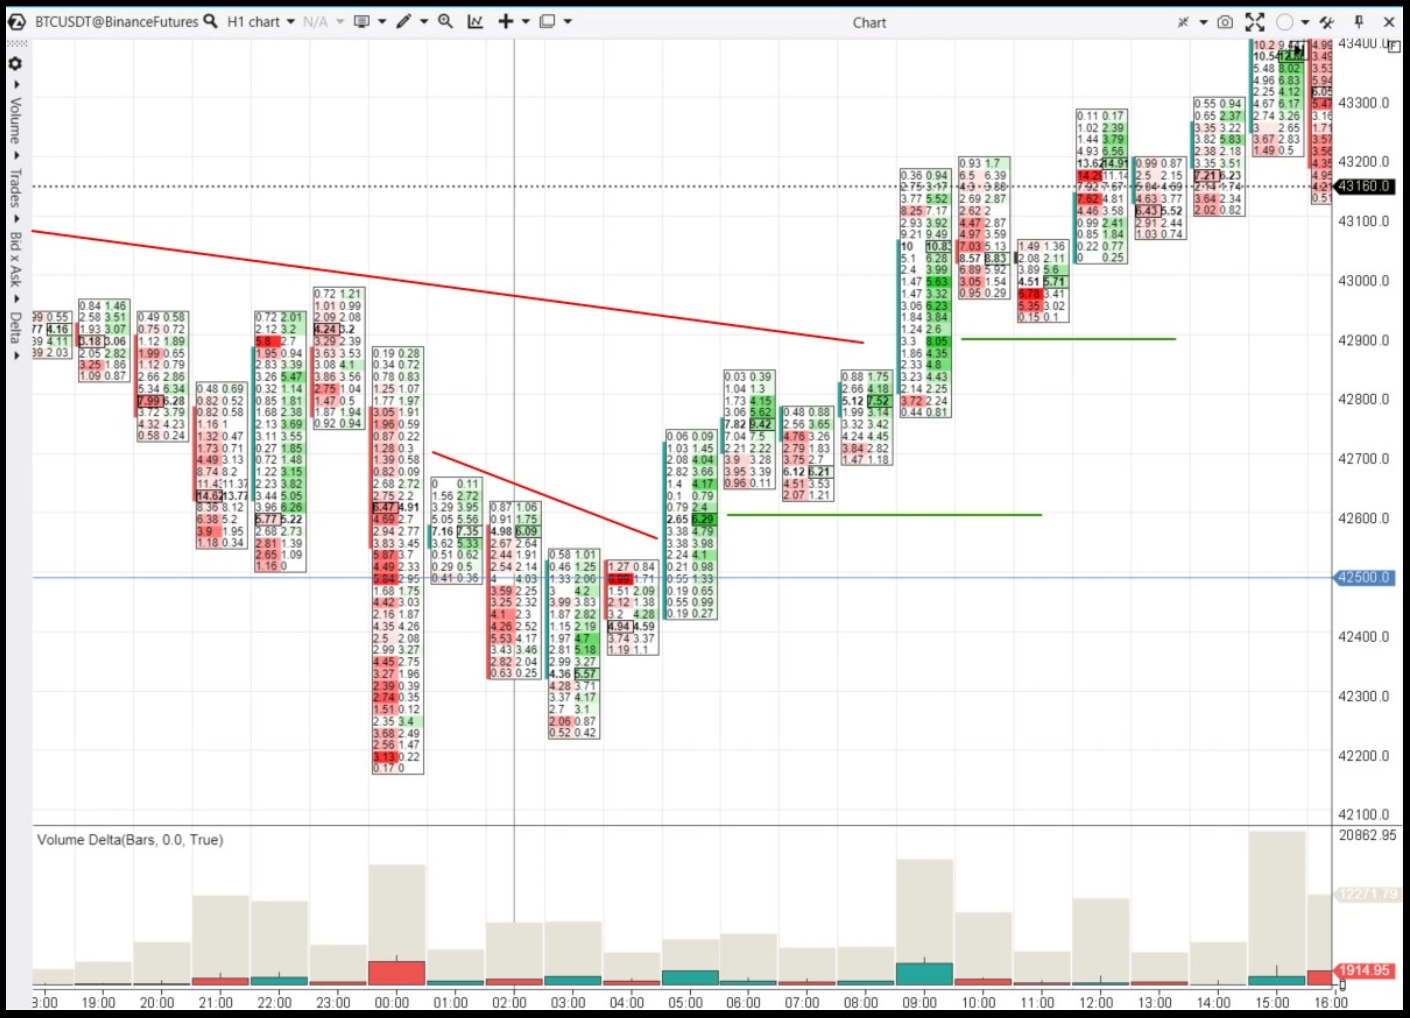
Footprint chart showing volume delta at each price level with buying/selling pressure visualization.
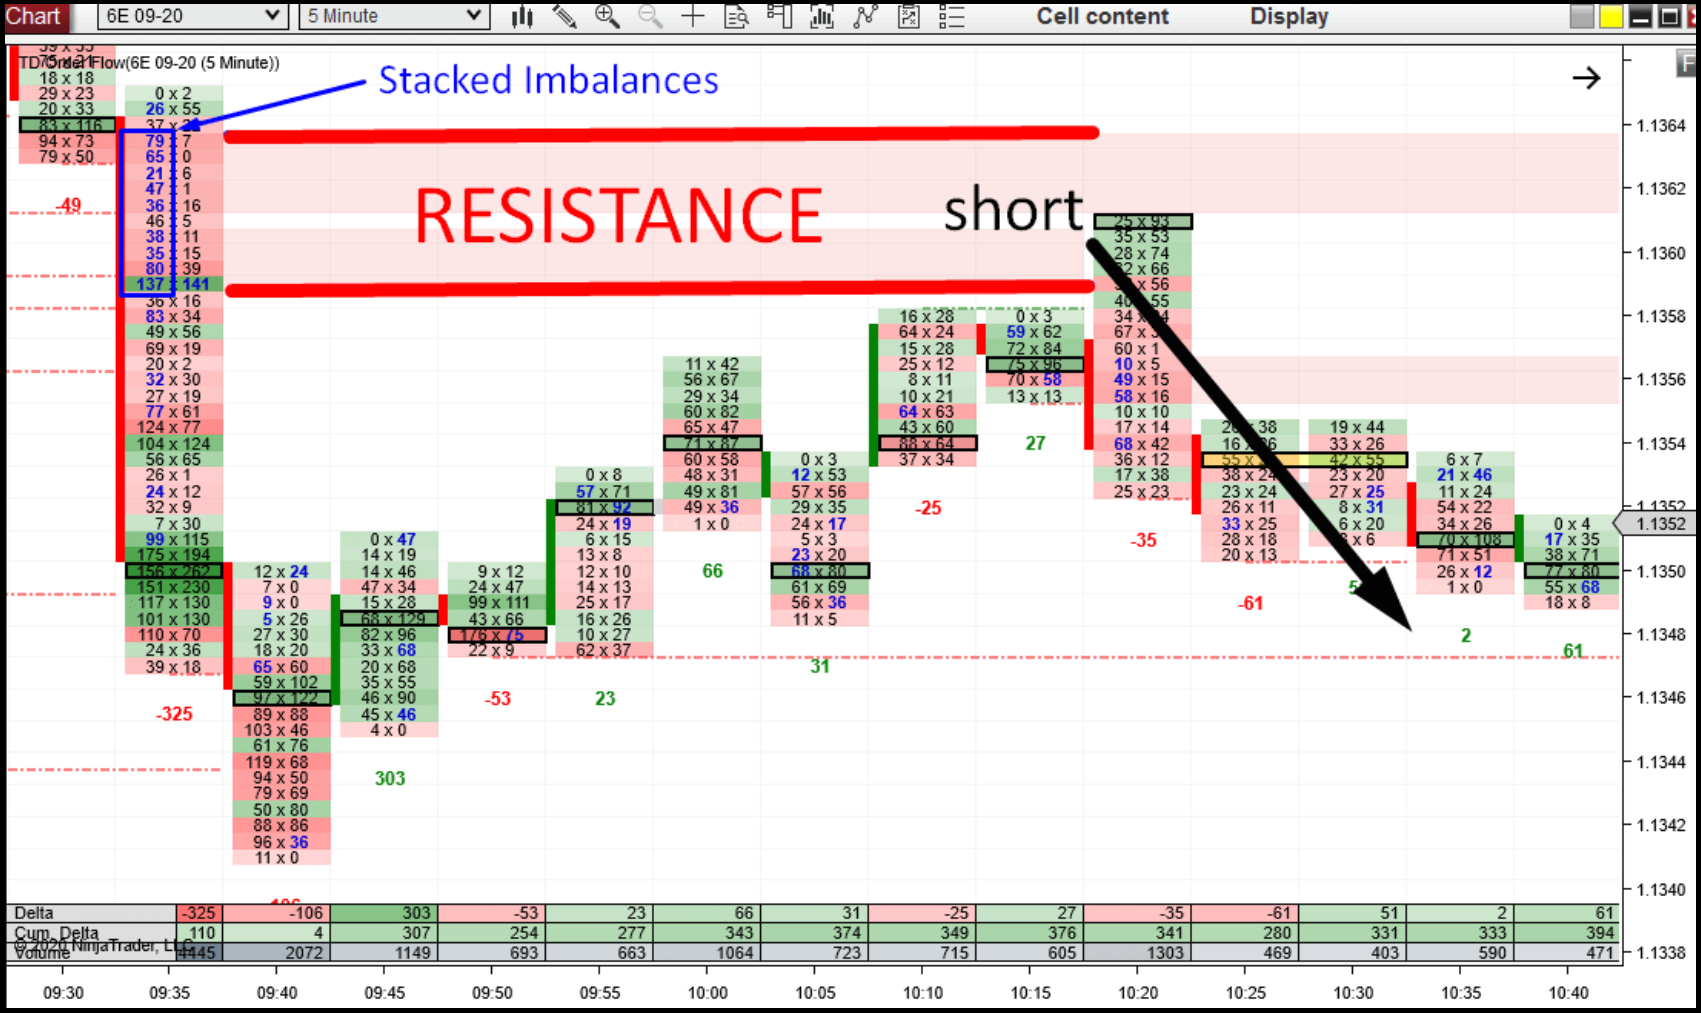
Stacked imbalances at resistance level indicating institutional selling pressure.
Recommended Videos
Trader Dale - The Only Order Flow Trading Guide You'll Ever Need
Comprehensive order flow trading tutorial covering delta, volume profile, and practical strategies.
SMB Capital - Best Scalping Strategy
Professional prop trading scalping techniques with tape reading and order flow analysis.
SMB Capital - The Most Powerful Trend Indicator
Learn how professional traders use trend analysis with order flow for high-probability trades.
Level 2 (L2) & DOM
Introduction
Level 2 (L2) and the Depth of Market (DOM) reveal the order book—the list of buy and sell orders stacked at every price. This is the closest look into the market's liquidity and intentions.
Core Breakdown
Level 2
Shows:
- -Best bid/ask
- -Second, third, and deeper layers of liquidity
- -Market makers' positioning
- -Spoofing or fake liquidity (sometimes visible)
DOM (Depth of Market)
Shows:
- -How much size is available at every price
- -Pulling/stacking behaviour
- -Real-time absorption
- -Iceberg orders (hidden size revealed through time)
DOM users watch the pace of the market, not just the numbers.
Visual Diagram - DOM Example
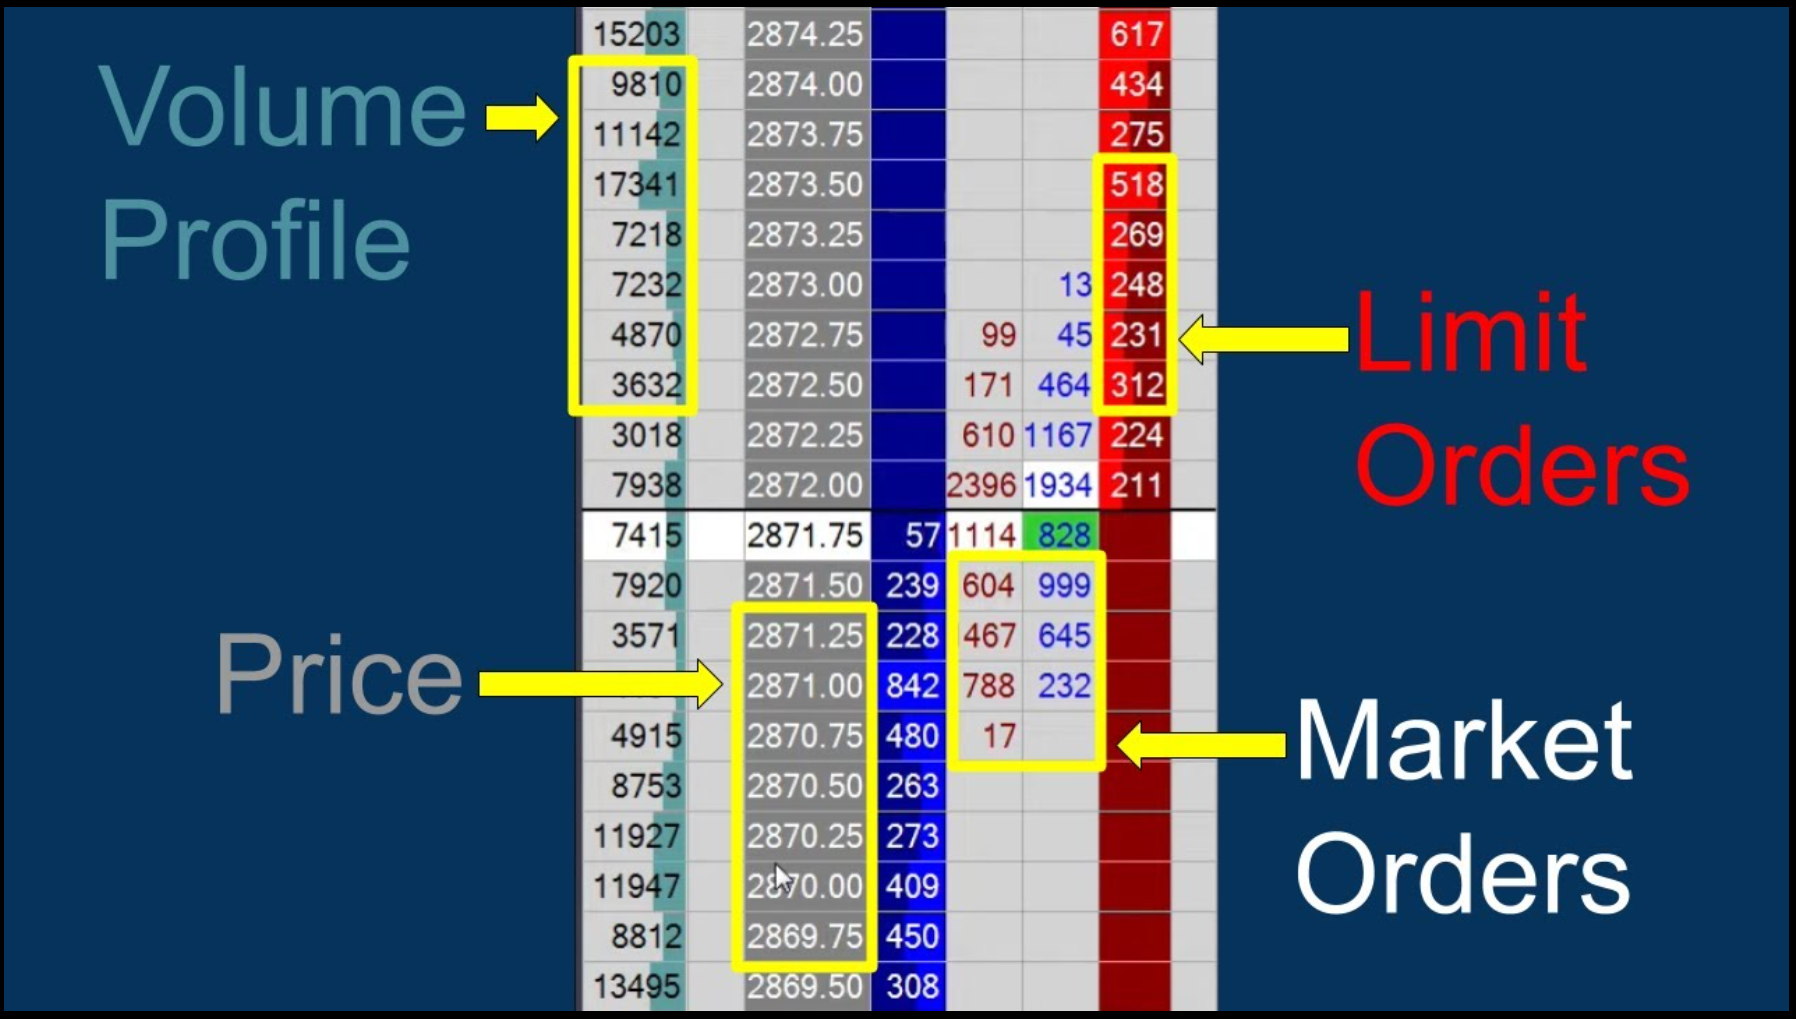
DOM ladder showing volume profile, price levels, limit orders, and market orders in real-time.
Market Structure
Introduction
Market structure is the foundation of all technical analysis. It defines how price moves through trends, ranges, and reversals. Understanding structure helps you know when to trade and when to wait.
Visual Examples
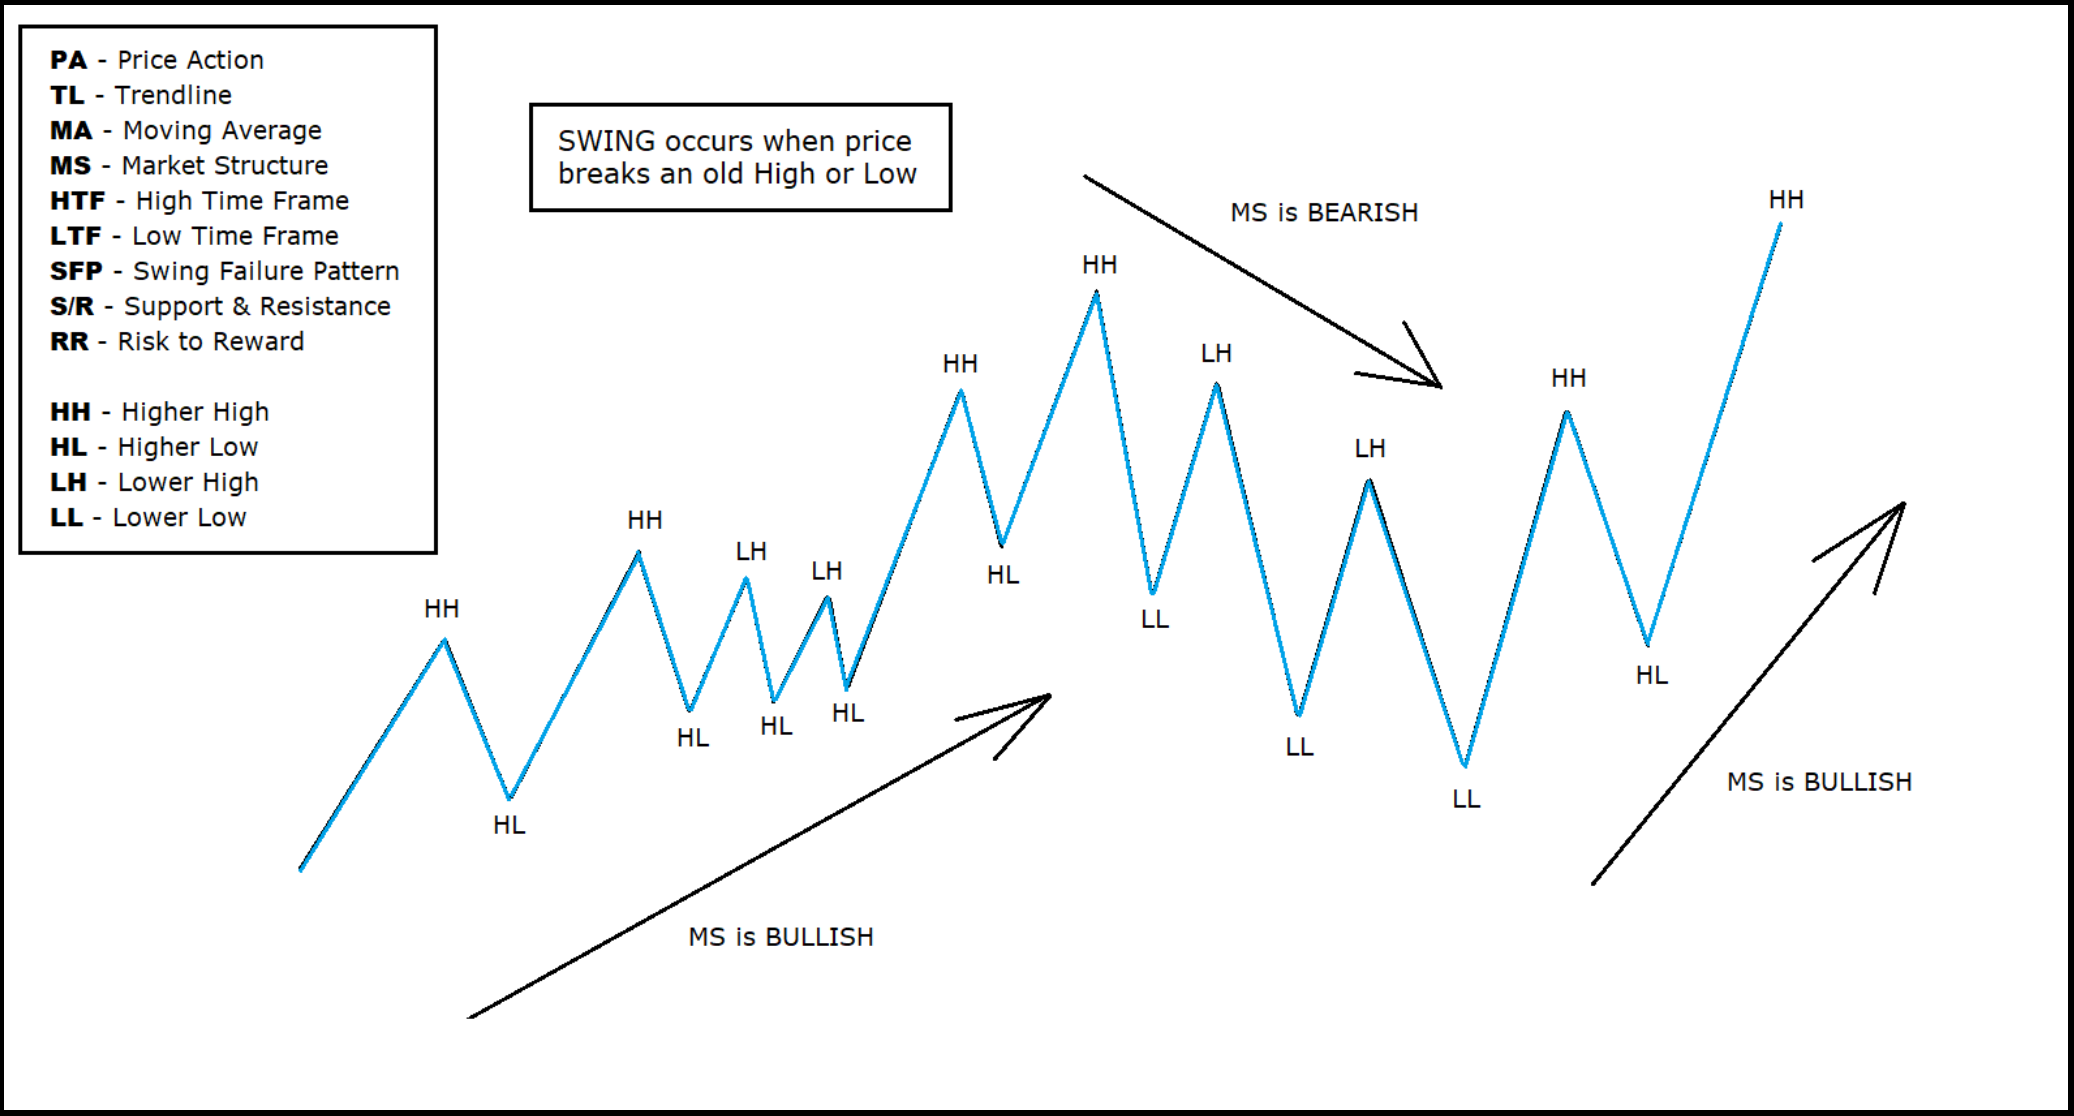
Higher highs and higher lows forming an uptrend structure.
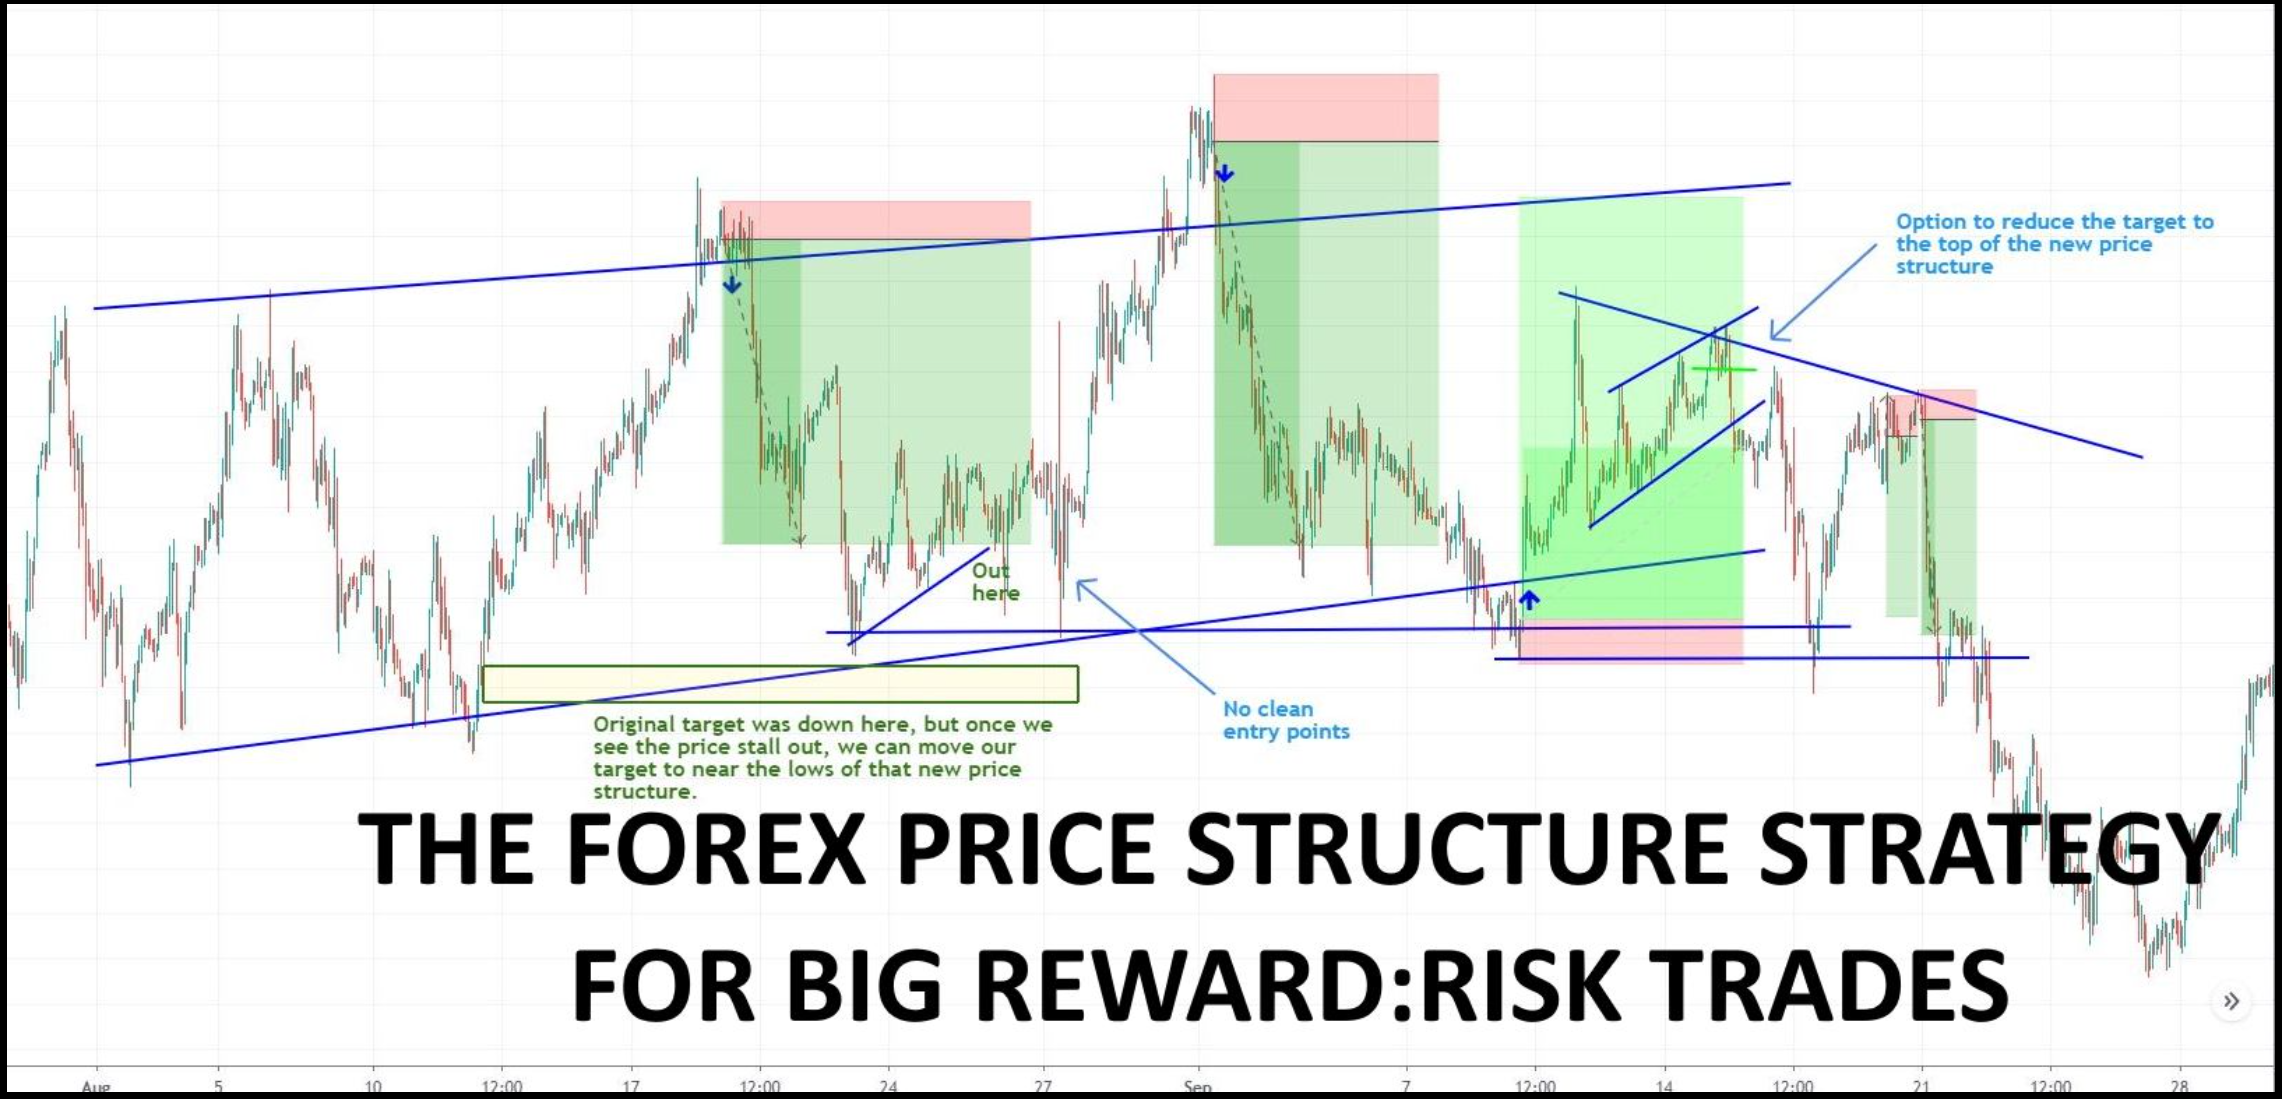
Key support and resistance levels with break of structure signals.
Psychology & Risk Management
Introduction
Trading psychology and risk management are the most overlooked aspects of trading. Even the best strategy fails without emotional discipline and proper position sizing. Master these and you master the game.
Visual Examples
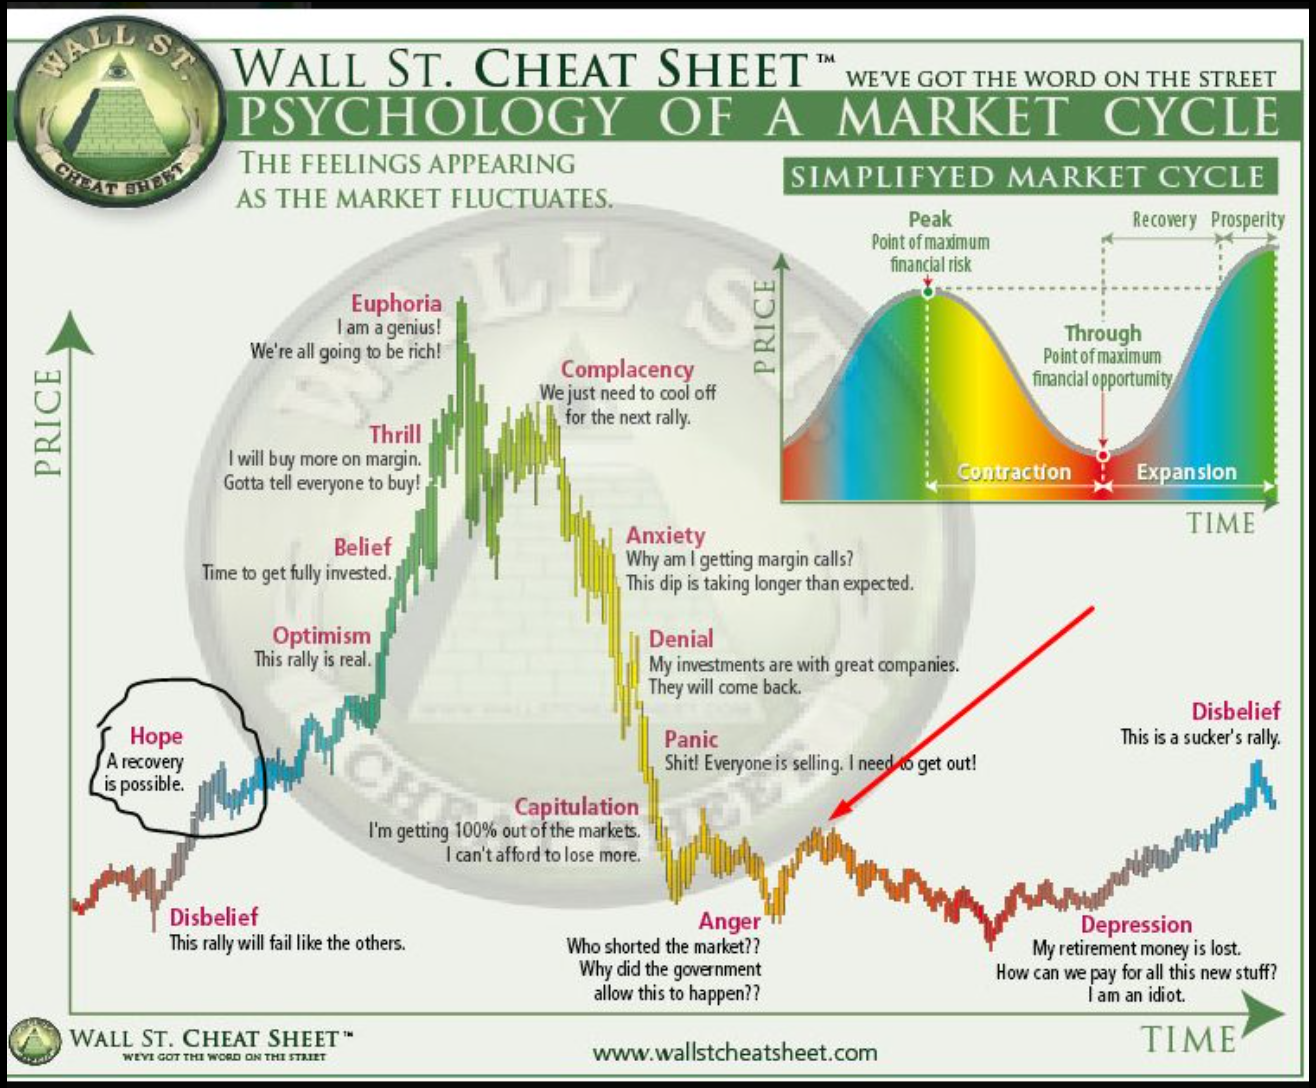
The emotional cycle of trading and how to recognize destructive patterns.

Risk management frameworks for consistent profitability.